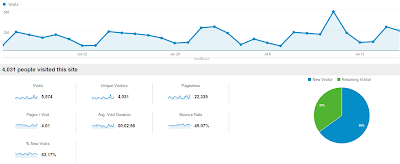
1. Audience Overview
Though this is the most simple and easy to find feature in your Google Analytics, do not discount the power of the Audience Overview. This area gives you a general snapshot of your site and can be where you spot indicators of weaknesses in your site layout or experience. In the audience overview Google Analytics breaks down your:
- Visits - how many visits in total to your site
- Unique Visitors - the number of unduplicated (counted only once) visitors to your website
- Pages / Visit - how many pages the average visitor viewed on your site per visit
- Bounce Rate - the percentage of visitors who made single page visits to your site before leaving
- Pageviews - how many views of your pages in total on your site
- Average Visit Duration - the average period of time a visitor spends on your site
- % New visits - the percentage of traffic to your site that are new visitors
Focused on CRE, you want a high number of new visitors to your site with high page views and average visit duration. You want new visitors because this means you are attracting new prospects and lots of pageviews and time spent on your site as you want these prospects looking at your property and broker pages. If the bounce rate on your site is over 50%, this could be an indicator that your site is not leading your visitor to their destination in a friendly way.
The "traffic sources" section of Google Analytics is your next stop to delve into the data behind your site. This shows you where your visitors come from. The "Referrals" section under "Sources" is especially important as this shows where visitors came from that were referred to your site via a link from another site. In this section, you can see the visits, pages / visit, average visit duration, % new visits and the bounce rate focused just on your referral traffic. Maybe you notice that the traffic from your local business journal has the higher page views and visit duration than the average visitor. This site is driving more quality visitors to your site, so why not invest in some banner advertising on that site?
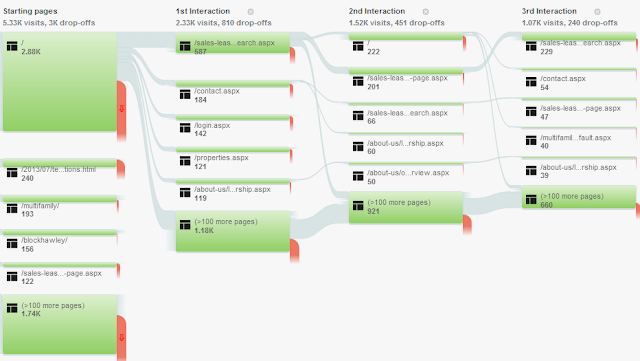
3. Audience - Visitors Flow
Under the audience section, there is a tool called "Visitors Flow". This function shows how visitors move through your site. You will be able to see where your visitors start and how they move through your site with the first interaction (click), second interaction ,etc. The red indicates major areas where your visitors drop off. If you see a page with a lot of red (drop offs), this may be an indication that this page needs an improved user experience.
4. Audience - Mobile
Another important piece of data to review and help you back your decisions for the design and experience of your site is the "Mobile" section under "Audience". This breaks down how many of your visitors peruse your site via desktop, mobile device, tablet, etc. If you see high bounce rates and you have a high percentage of mobile users, this could be an indication that you need to create a mobile site or improve your site experience for mobile with larger text and click-able buttons.
5. Conversions
The "Conversions" section of Google Analytics is where you can put your site and your data-backed decisions to the test. In this area, you can create "Goals" that allow you to track different measures of success. For instance, if one of my goals is to get more visitors on my site requesting information from my brokers on buildings, I could create a "Goal URL" that would track how many people fill out the contact form on my site. I could set the Goal URL to track how many visitors make it to the "Thank You" page after my contact form and that could be an indicator of how many visitors my site leads to that form. Or, Conversions also allows you to create "Funnel Visualizations" where you indicate how you want the ideal visitor to move through your site and which stops they make and then track that.
Google Analytics equips the CRE professional with the tools to make data-backed decisions when modifying and improving their site. Putting these simple tools to use can help you drill down the opportunities and weaknesses on your site and convert your site visitors to valuable prospects.
Contributing Author:

Paige Salveter
Director of Marketing & Communications
Block Real Estate Services


No comments:
Post a Comment